Three things to take away
What is the outlook for Denmark and Sweden’s marine sector – and how is the geopolitical and economic landscape impacting growth
What are the major risk areas for marine firms in the Nordics in 2024
What can Scandinavian marine firms do to mitigate risk, meet policy regulations and promote growth
The marine sectors in Denmark and Sweden are critical to their respective economies and in the key future concern for shipping globally: decarbonisation. Several companies in the region continue to focus on innovation and partnerships around development of new fuels and new routes linking specific ports.
The marine sectors also face other common industry challenges including labour shortages, which have had a negative impact on port and marine sector operational efficiency. Identifying solutions to improve workforce recruitment and retention rates will occupy sector minds in the coming years.
A shift in the security environment in the Baltic Sea impacts both Sweden and Denmark as littoral states. Increased security concerns have led to shows of force through naval exercises, and critical infrastructure remains vulnerable.
Introduction
The marine sectors in Denmark and Sweden are critical to their respective economies. The sectors are also critical in the key future concern for shipping globally: decarbonisation. Major shipping and logistics company Maersk, headquartered in Denmark, has been among companies seeking to reduce the sector’s environmental impact and several companies in the region continue to focus on innovation and partnerships around development of new fuels and new routes linking specific ports. In common with marine sectors in many countries worldwide, Danish and Swedish marine companies will continue to face increased environmental scrutiny from regulators and climate groups.
The respective marine sectors also face other common industry challenges. Labour shortages have had a negative impact on port and marine sector operational efficiency and will likely continue. Identifying solutions to improve workforce recruitment and retention rates will occupy sector minds in the coming years.
A shift in the security environment in the Baltic Sea impacts both Sweden and Denmark as littoral states. Increased security concerns have led to shows of force through naval exercises, and critical infrastructure remains vulnerable. The explosions that ruptured the Nord Stream pipelines in September 2022 occurred in Danish and Swedish exclusive economic zones and the Swedish prosecutor hopes to decide by the end of the year whether to bring charges. ‘Dark fleet’ tankers used to transport Russian oil present a navigational risk in the Baltic. The fleet is often of older tonnage, and could be poorly maintained, having received fewer inspections or repairs. The risk is increased along narrow, densely trafficked waterways such as the Danish Straits.
Size of the marine industry
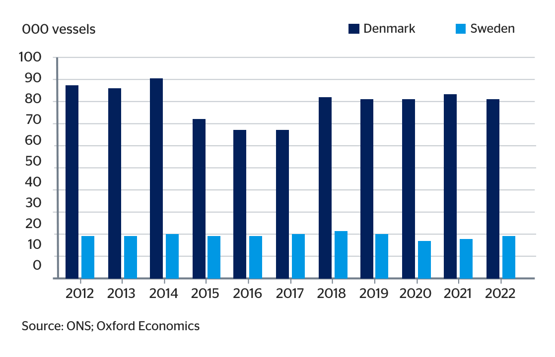
In 2022, an average of 81,060 and 18,213 commercial ships visited Danish and Swedish ports, respectively. The vast majority (96% in Denmark and 86% in Sweden) carried general cargo. In second rank came dry bulk carriers in Denmark and liquid bulk tankers in Sweden.
In 2022, 41.2 million and 24.9 million passengers passed through Danish and Swedish ports as they began or ended sea journeys or visited on cruise.1 Of these, virtually all were ferry passengers, with very low numbers on cruise holidays. Passenger traffic is well below its pre-Covid-19 pandemic figures of 44.2 million and 30.5 million respectively for 2019. Levels may therefore recover in the future, as people resume travelling in greater numbers.
Water transport firms in Denmark and Sweden made a €16.4 billion and €0.8 billion contribution to each country’s GDP, respectively.
1. Eurostat. 2023. Maritime transport – main annual results. Accessed November 2023.
Fig. 1: Number of vessels visiting the main ports in Denmark and Sweden, 2012 to 2022
Economic contribution of the marine sector
The water transport sector’s main role in the economy is to transport heavy, bulk freight and passengers. In addition, the sector creates connectivity and jobs. The latest data (2021) indicates that there were 267 and 1,014 firms operating in the water transport sector in Denmark and Sweden. They made a €16.4 billion and €0.8 billion contribution to each country’s GDP, respectively.2 The Danish figures are unusually high because of the elevated container freight rates that were prevalent towards the end of the Covid pandemic, as firms scrambled for inputs due to supply chain shortages. This boosted Maersk’s profits (which is headquartered in Denmark) which feeds into GDP.
In more normal years, the water transport industry contributes about 2% of Danish GDP. This is the largest contribution made to total output by the sector in any of the 27 EU Member States. Shipping is Denmark’s largest export industry, making a substantial contribution to Denmark’s balance of payments.
2. Eurostat. 2023. Maritime transport - main annual results. Accessed November 2023.
We expect water transport’s contribution to Danish GDP to
contract by 36% in 2023, largely reflecting the fall in container
rates. Maersk reports the average freight rates it received in
2023Q3 was 58% below that of a year earlier, which more than
offset a 5% increase in the volume of containers loaded onto its
ships. We forecast a bounce back of 15% in 2024 and 12% in 2025.
Economic challenges facing the marine industry
In the quarterly business conditions survey undertaken by the European Commission, water transport firms said the main factor limiting their business in 2023Q4 was lack of demand.3 This was cited by 75% and 72% of the firms surveyed, respectively (Fig 2). In the monthly survey in October, a small net balance of 14% and 2% of the water transport firms surveyed in Denmark and Sweden perceived demand for their companies’ services would improve over the next three months.4
3. European Commission. 2023. "Business and consumer surveys". Accessed November 2023.
4. European Commission. 2023. "Business and consumer surveys". Accessed November 2023. A net balance shows the percentage of firms expecting demand for their services to increase over the next three month from the percentage expecting it to decrease.
Water transport firms said the main factor limiting their business in 2023Q4 was lack of demand.
Fig 2. What main factors are currently limiting your business in 2023Q4?
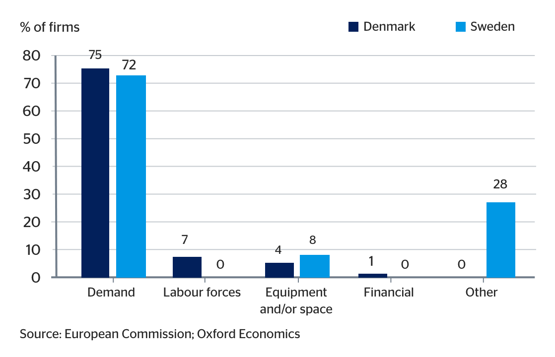
Key things to watch
- Baltic geopolitics: The spillover effects of the ongoing conflict in Ukraine include the shift in the security environment in the Baltic Sea, of which both Sweden and Denmark are littoral states. The countries were both directly impacted by the Nord Stream incident and have previously reported Russian incursions into their waters – for example the reported June 2022 entry of a Russian warship into Danish territorial waters north of the island of Bornholm. Such action is likely a show of force, which has increased in frequency since the outbreak of the conflict. Although the cause of damage to undersea cabling between Sweden and Estonia in October has not been established, the incident further demonstrates potential for sabotage to affect the region. The presence of ‘dark fleet’ tankers, including tankers leaving Russian Baltic ports, continue to present a navigational risk. Russia sends about a third of its seaborne oil exports through the Danish straits.5
- Activism to continue: Linked to the war in Ukraine, environmental activists have targeted vessels transporting Russian energy. Greenpeace blocked a ship-to-ship oil transfer in Danish waters and the offload of gas at the Swedish LNG terminal Nynäshamn. Focus on Russian vessels will continue but Greenpeace and local activist groups may disrupt the Danish and Swedish marine sectors with protests about wider environmental concerns. In addition to targeting vessels and ports, they may increase the scope of their actions, for instance blocking access to terminals. The group Reclaim the Future protested on the road outside Malmö port in June and July. These actions pose additional operational disruption and reputational damage risks to operators.
5. Reuters. 2023. Russian oil tankers not targeted in EU sanctions proposal - EU diplomats. Accessed November 2023.
6. What do Red Sea assaults mean for global trade? - BBC News
- Green direction: The Danish and Swedish marine sectors will also continue to address their respective environmental footprint. In January 2024, the EU’s Emissions Trading System (EU ETS) will be extended to cover CO2 emissions of maritime transport. Additionally, the marine sectors could be indirectly affected by wider EU environmental regulation efforts: for example, the Carbon Border Adjustment Mechanism transitional period, from 1 October 2023, could cause shifts to trading partners, and therefore trade flows.
- Global supply chains: Disruption in the global supply chain can happen at any time. Currently, delays can be seen in the typically busy shipping lanes of the Red Sea, as many of the world's largest shipping companies divert their vessels away from the region. Alternative shipping routes may remove the risk of attack in the Bab al-Mandab Strait – but will add up to 10 days shipping time and cost millions of dollars.6
Macroeconomic risks to the water transport sector
Our central forecasts for the water transport industry differ markedly for Denmark and Sweden over the next three years. We expect water transport’s contribution to Danish GDP to contract by 36% in 2023, largely reflecting the fall in container rates. Maersk reports the average freight rates it received in 2023Q3 was 58% below that of a year earlier, which more than offset a 5% increase in the volume of containers loaded onto its ships.6 We forecast a bounce back of 15% in 2024 and 12% in 2025.7 The accuracy of this forecast will partly depend on the extent to which container freight rates fall further due to extra container shipping capacity coming on stream. In contrast, the smaller Swedish industry is predicted to grow by 9% in 2023, followed by growth of 7% and 6% in 2024 and 2025. This is a function of projections for the growth of economic activity in Sweden.
The differences in the forecasts for the two country’s water transport industries partly reflects their customer base. The much larger Danish industry is orientated towards global customers. OECD data suggests it received just 26% of its income from customers within Denmark, while the remainder came from customers outside of the country.8 In contrast, the Swedish industry is more domestically-orientated, it received 58% of its revenue from domestic customers.
The future is surrounded by uncertainty. To explore the impacts that various scenarios may have on the water transport industry, we have used Oxford Economics’ Global Scenario Service.9 This models different economic scenarios which may occur in the future depending on potential shocks, policies adopted by governments, or behaviours adopted by firms and households. We look at three hypotheses that are more negative than the central forecast discussed above, namely an asset price shock, tighter credit conditions, and increased tensions between China and Taiwan.
Fig. 3. Percentage deviation from the baseline forecast of water transport gross value added in three different macroeconomic scenarios
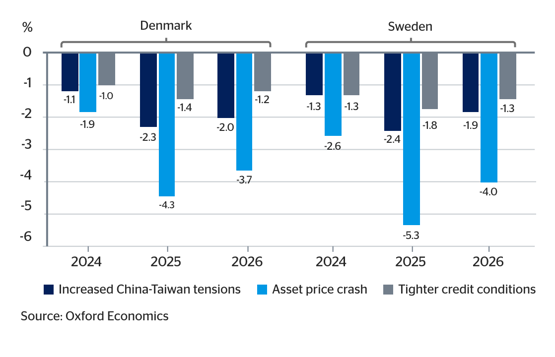
If any of these three happen, the water transport industry’s contribution to GDP in both countries will be smaller than under the central forecast. The scale of the contraction peaks in 2025, and is larger in Sweden than in Denmark in all three scenarios due to the sector’s different customer types. The scale of the contraction in the water transport industry’s output is largest in the asset price shock scenario, and smallest if global credit conditions tighten.
6. A.P. Møller - Mærsk A/SMaersk. 2023. Q3 2023 Investor Presentation.
7. Oxford Economics. 2023. Global Industry Service. Accessed November 2023.
8. OECD. 2023. OECD Inter-Country Input-Output (ICIO) Tables. November 2023.
9. Oxford Economics. 2023. Global Scenario Service. Accessed November 2023.
Our central forecasts for the water transport industry differ markedly for Denmark and Sweden over the next three years. We expect water transport’s contribution to Danish GDP to contract by 36% in 2023, largely reflecting the fall in container rates. Maersk reports the average freight rates it received in 2023Q3 was 58% below that of a year earlier, which more than offset a 5% increase in the volume of containers loaded onto its ships.6 We forecast a bounce back of 15% in 2024 and 12% in 2025.7 The accuracy of this forecast will partly depend on the extent to which container freight rates fall further due to extra container shipping capacity coming on stream. In contrast, the smaller Swedish industry is predicted to grow by 9% in 2023, followed by growth of 7% and 6% in 2024 and 2025. This is a function of projections for the growth of economic activity in Sweden.
The differences in the forecasts for the two country’s water transport industries partly reflects their customer base. The much larger Danish industry is orientated towards global customers. OECD data suggests it received just 26% of its income from customers within Denmark, while the remainder came from customers outside of the country.8 In contrast, the Swedish industry is more domestically-orientated, it received 58% of its revenue from domestic customers.
The future is surrounded by uncertainty. To explore the impacts that various scenarios may have on the water transport industry, we have used Oxford Economics’ Global Scenario Service.9 This models different economic scenarios which may occur in the future depending on potential shocks, policies adopted by governments, or behaviours adopted by firms and households. We look at three hypotheses that are more negative than the central forecast discussed above, namely an asset price shock, tighter credit conditions, and increased tensions between China and Taiwan.
Fig. 3. Percentage deviation from the baseline forecast of water transport gross value added in three different macroeconomic scenarios
If any of these three happen, the water transport industry’s contribution to GDP in both countries will be smaller than under the central forecast. The scale of the contraction peaks in 2025, and is larger in Sweden than in Denmark in all three scenarios due to the sector’s different customer types. The scale of the contraction in the water transport industry’s output is largest in the asset price shock scenario, and smallest if global credit conditions tighten.
6. A.P. Møller - Mærsk A/SMaersk. 2023. Q3 2023 Investor Presentation.
7. Oxford Economics. 2023. Global Industry Service. Accessed November 2023.
8. OECD. 2023. OECD Inter-Country Input-Output (ICIO) Tables. November 2023.
9. Oxford Economics. 2023. Global Scenario Service. Accessed November 2023.
Advice for business
With the global economy growing relatively slowly, pricing seems likely to dominate the outlook for the sector’s profitability over the next few years. This includes both future freight rates on global container shipping lines, but also the evolution of input costs (such as fuel and port rates) impacting all types of maritime transport. Firms need to actively monitor their input and output prices, and think clearly about their own decisions. This may range from whether to enter longer term contracts, to judgements about the price sensitivity of their different client types, or views on their acceptable profit margin.
When possible, companies should also try to diversify their transport routes to lower risk from one-off events in particular countries. For example, the alternative shipping routes taken around the Cape of Good Hope and away from the Red Sea at present will drive shipping rates up (4% in the first week of attacks on commercial vessels10) and place the biggest delay on consumer goods.
The number of passengers that embarked and disembarked in Danish and Swedish ports in 2022 was still 7% and 18% below their pre-pandemic levels (2019), respectively. Firms need to think creatively of ways of attracting back those missing travellers. Likewise, they need to actively monitor and forecast the speed and extent to which they return, to judge the appropriate level of services they provide.
10. What do Red Sea assaults mean for global trade? - BBC News
Marine transport is subject to considerable governmental intervention. This in part reflects ever changing geopolitical events and longer-term policy actions. Firms should maintain awareness of where military activity may break out, what economic sanctions they need to comply with and when environmental regulations may evolve (such as the EU’s Emission Trading Scheme covering all large ships entering EU ports from January 2024).
Another source of risk is technological hazards. These include engine issues, structural problems, failure of navigation equipment, and other things that can go wrong with shipments or ships’ equipment. One way to prevent that, besides complying with global norms, is by hiring specialist inspection services for cargo ships and cruises. In addition, it is also necessary to keep all equipment up to date and to inspect ships before they depart.
With demand growing relatively slowly, attention in 2023 has focussed on pricing - most notably the marked decline in freight container rates, which had been driven up by the scramble for materials when the world emerged from Covid-19 lockdowns. The rate decline has led to a marked reduction in container lines’ profitability and a forecast 36% reduction in maritime gross value added in Denmark. Fuel prices for shipping have also been volatile and geopolitical events suggest this is unlikely to stabilise in the near term. We forecast the Danish and Swedish water transport sector’s contribution to GDP are both likely to grow by 15% and 7% in 2024 respectively, but the accuracy of this forecast will again be subject to price movements.
This report has been developed for QBE by Control Risks and Oxford Economics
This report has been developed for QBE by Control Risks and Oxford Economics
Global commerce
Forecast for international trade in Denmark and Sweden
More like this
Sign-up to be notified about future articles from the Sector Resilience Series, and other thoughts, reports or insights from QBE.
Subscribe now